
You tap a "Request a Quote" button on your site, wait a full second without a single sign anything happened, tap it again out of habit, and then realize the page froze mid-click.
Here is the plain truth:
Visitors judge a website the moment they touch it. When a menu hangs, a filter lags, or a button gives zero feedback, real people wonder if their tap even registered—and plenty of them leave before a form ever submits. Today you will discover how to spot sluggish interactions, pinpoint where delays hide, and keep every tap feeling crisp.
Years ago, untangling slow clicks meant hunting through bulky scripts without clear visibility into what users actually felt. Modern builders make setting up a clean foundation far easier. When you build with BoltWeb, everything is set up to scale as your business grows—giving you a clean starting point while still letting you test real interactions on your live pages. Inside BoltWeb, AI Foundry helps you shape clean pages and structure your site fast so you can focus on serving customers.
Let's walk through how to diagnose slow actions and make every control feel responsive.
1. Why Do Website Buttons, Menus, and Forms Sometimes Feel Slow?
Picture a visitor tapping a mobile menu that sticks shut for half a second, clicking a product filter that stutters, or hitting submit on a contact form with no sign anything is happening. Even when a page looks finished, sluggish interactions make a site feel unreliable.
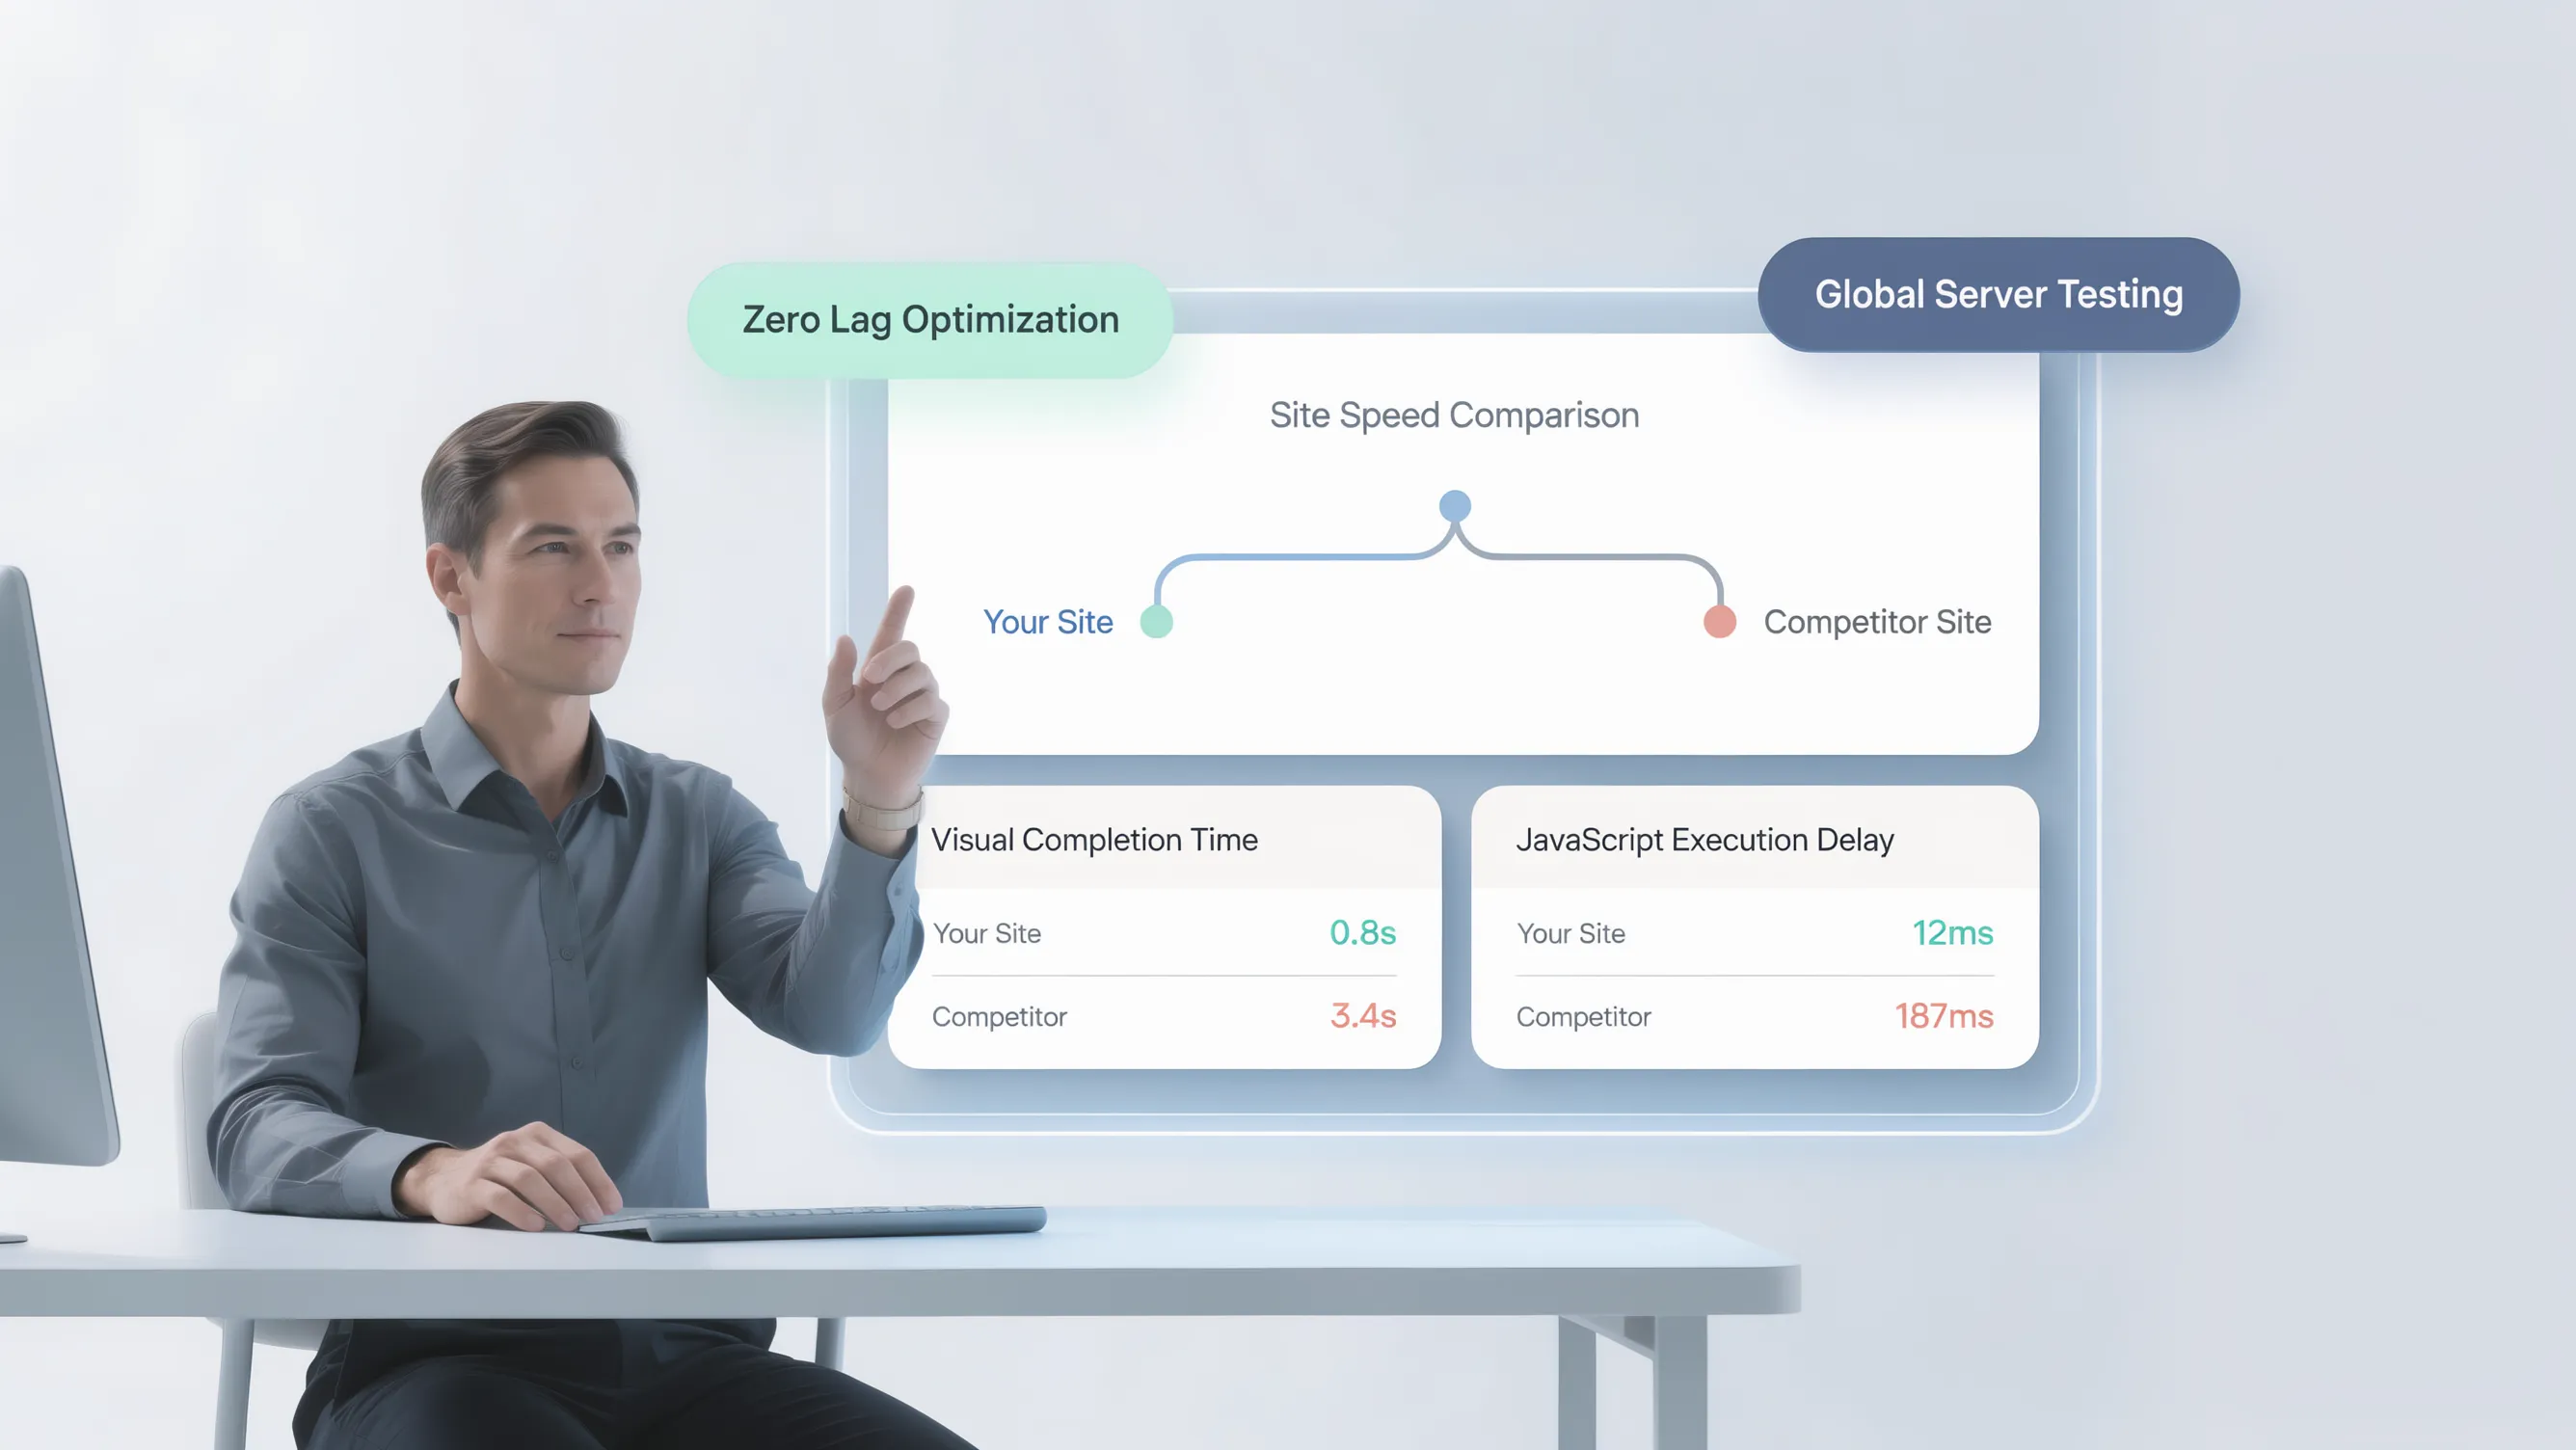
Interaction to Next Paint (INP) measures how quickly a page responds visually to user interactions across a visit. Knowing how to improve website responsiveness starts with spotting where a slow button response gets in a visitor's way.
| Rating | Target | What It Means |
|---|---|---|
| Good | 200 ms or less | Interactions respond promptly. |
| Needs improvement | 200–500 ms | Interactions may feel delayed. |
| Poor | Above 500 ms | Interactions are likely to feel sluggish. |
2. How Google Measures Interaction to Next Paint (INP)
Initial page load speed tells you how fast the screen first paints, not how snappy that page feels once someone starts using it.
The Interaction to Next Paint metric watches clicks, taps, and keyboard actions throughout a page visit, measuring from user input until the browser paints the next visual update—not just initial loading or the very first click. Clear INP measurement makes the INP meaning much easier to apply in real projects.
3. Find Out Which Buttons and Website Interactions Have the Worst INP
A single score can hide the exact control slowing people down—whether that is a navigation drawer, live search box, catalog filter, dropdown, form submit button, modal, or checkout step.
Different visitors can also hit different delays depending on their device, browser state, and what they click. Checking field attribution alongside Google PageSpeed Insights, Chrome DevTools, and the Chrome UX Report helps you narrow down INP debugging from a broad warning to slow website buttons and specific INP issues. To identify slow interactions, trace the exact action visitors take before a delay shows up.
4. Understand Input Delay, Processing Time, and Presentation Delay
One slow tap usually combines three separate stages, and each points to a different fix:
- Input delay: Time before event processing starts because earlier browser work is still in the way.
- Processing time: Time spent running event callbacks attached to the interaction.
- Presentation delay: Time until the browser finishes layout, paint, and compositing to show the next frame.
Separating input delay, processing time, and presentation delay turns a vague INP breakdown into a clear diagnostic check (and pairs well with our guide on how to fix Core Web Vitals).
5. Find JavaScript Tasks That Keep the Browser Busy
A browser relies on a single main thread for much of its UI and script work. When heavy loops, large calculations, big DOM changes, synchronous tasks, or startup code hold that thread, a new tap has to wait in line.
Recording a performance trace helps you spot long JavaScript tasks behind main thread blocking and JavaScript INP slowdowns. Better browser responsiveness starts by finding which script is holding the queue open.
Launch Fast-Responding Pages With BoltWeb
Build a Clean Site Foundation That Scales Without Technical Headaches
Do not let clunky pages or scattered workflows slow down your business as you publish new offers and guides. Create your storefront on BoltWeb with AI Foundry to structure pages cleanly, connect your content smoothly, and keep your site ready to grow.
Get Started On Your Journey →6. Make Clicks and Taps Respond Immediately with Better Event Handlers
Event handlers do their best work when they stay lean, skip extra calculations, delegate shared events cleanly where appropriate, and give immediate visual feedback rather than making a visitor wonder if anything happened.
A visitor submitting a form should not be left wondering whether the button worked.
<button id="submit-button" type="button">
  Submit request
</button>

<p id="status" aria-live="polite"></p>

<script>
const button = document.querySelector("#submit-button");
const status = document.querySelector("#status");

button.addEventListener("click", async () => {
  button.disabled = true;
  status.textContent = "Submitting your request...";

  try {
    await submitRequest();
    status.textContent = "Your request was submitted.";
  } catch {
    status.textContent = "Please try again.";
  } finally {
    button.disabled = false;
  }
});
</script>
That immediate status text lets the visitor know their click registered before submitRequest() finishes.
function processLargeList(items) {
  let index = 0;

  function processBatch() {
    const end = Math.min(index + 50, items.length);

    while (index < end) {
      processItem(items[index]);
      index++;
    }

    if (index < items.length) {
      setTimeout(processBatch, 0);
    }
  }

  processBatch();
}
Breaking work into smaller batches lets the browser handle pending input between chunks—pick batch sizes and scheduling based on profiling rather than copying numbers blindly.
const worker = new Worker("/scripts/calculation-worker.js");

worker.postMessage({
  action: "calculate",
  values: [10, 20, 30, 40]
});

worker.onmessage = (event) => {
  console.log("Calculation result:", event.data);
};
Web Workers handle independent data work well, though they cannot touch the DOM directly and will not fix heavy UI rendering on their own.
let searchTimer;

searchInput.addEventListener("input", (event) => {
  clearTimeout(searchTimer);

  const query = event.target.value;

  searchTimer = setTimeout(() => {
    searchProducts(query);
  }, 250);
});
Debouncing cuts down repeated searches while someone is still typing, while the input field still updates right away.
Refining event handlers INP helps improve button response, cuts click delay, and makes JavaScript event optimization practical on real controls.
7. Break Up Heavy JavaScript Work Without Making Features Disappear
You do not have to strip away helpful features to make a page feel quicker. Often you only need to yield back to the browser, split code, delay non-essential setup until needed, or move heavy math to a worker.
Thoughtful JavaScript performance optimization helps you reduce JavaScript execution, break up long tasks, and use web workers where they fit—without gutting what makes your site useful.
8. Reduce Third-Party Scripts That Slow Down User Interactions
Analytics tags, ad scripts, chat widgets, tracking pixels, heatmaps, social embeds, and outside libraries all compete for main-thread time—especially right when visitors interact.
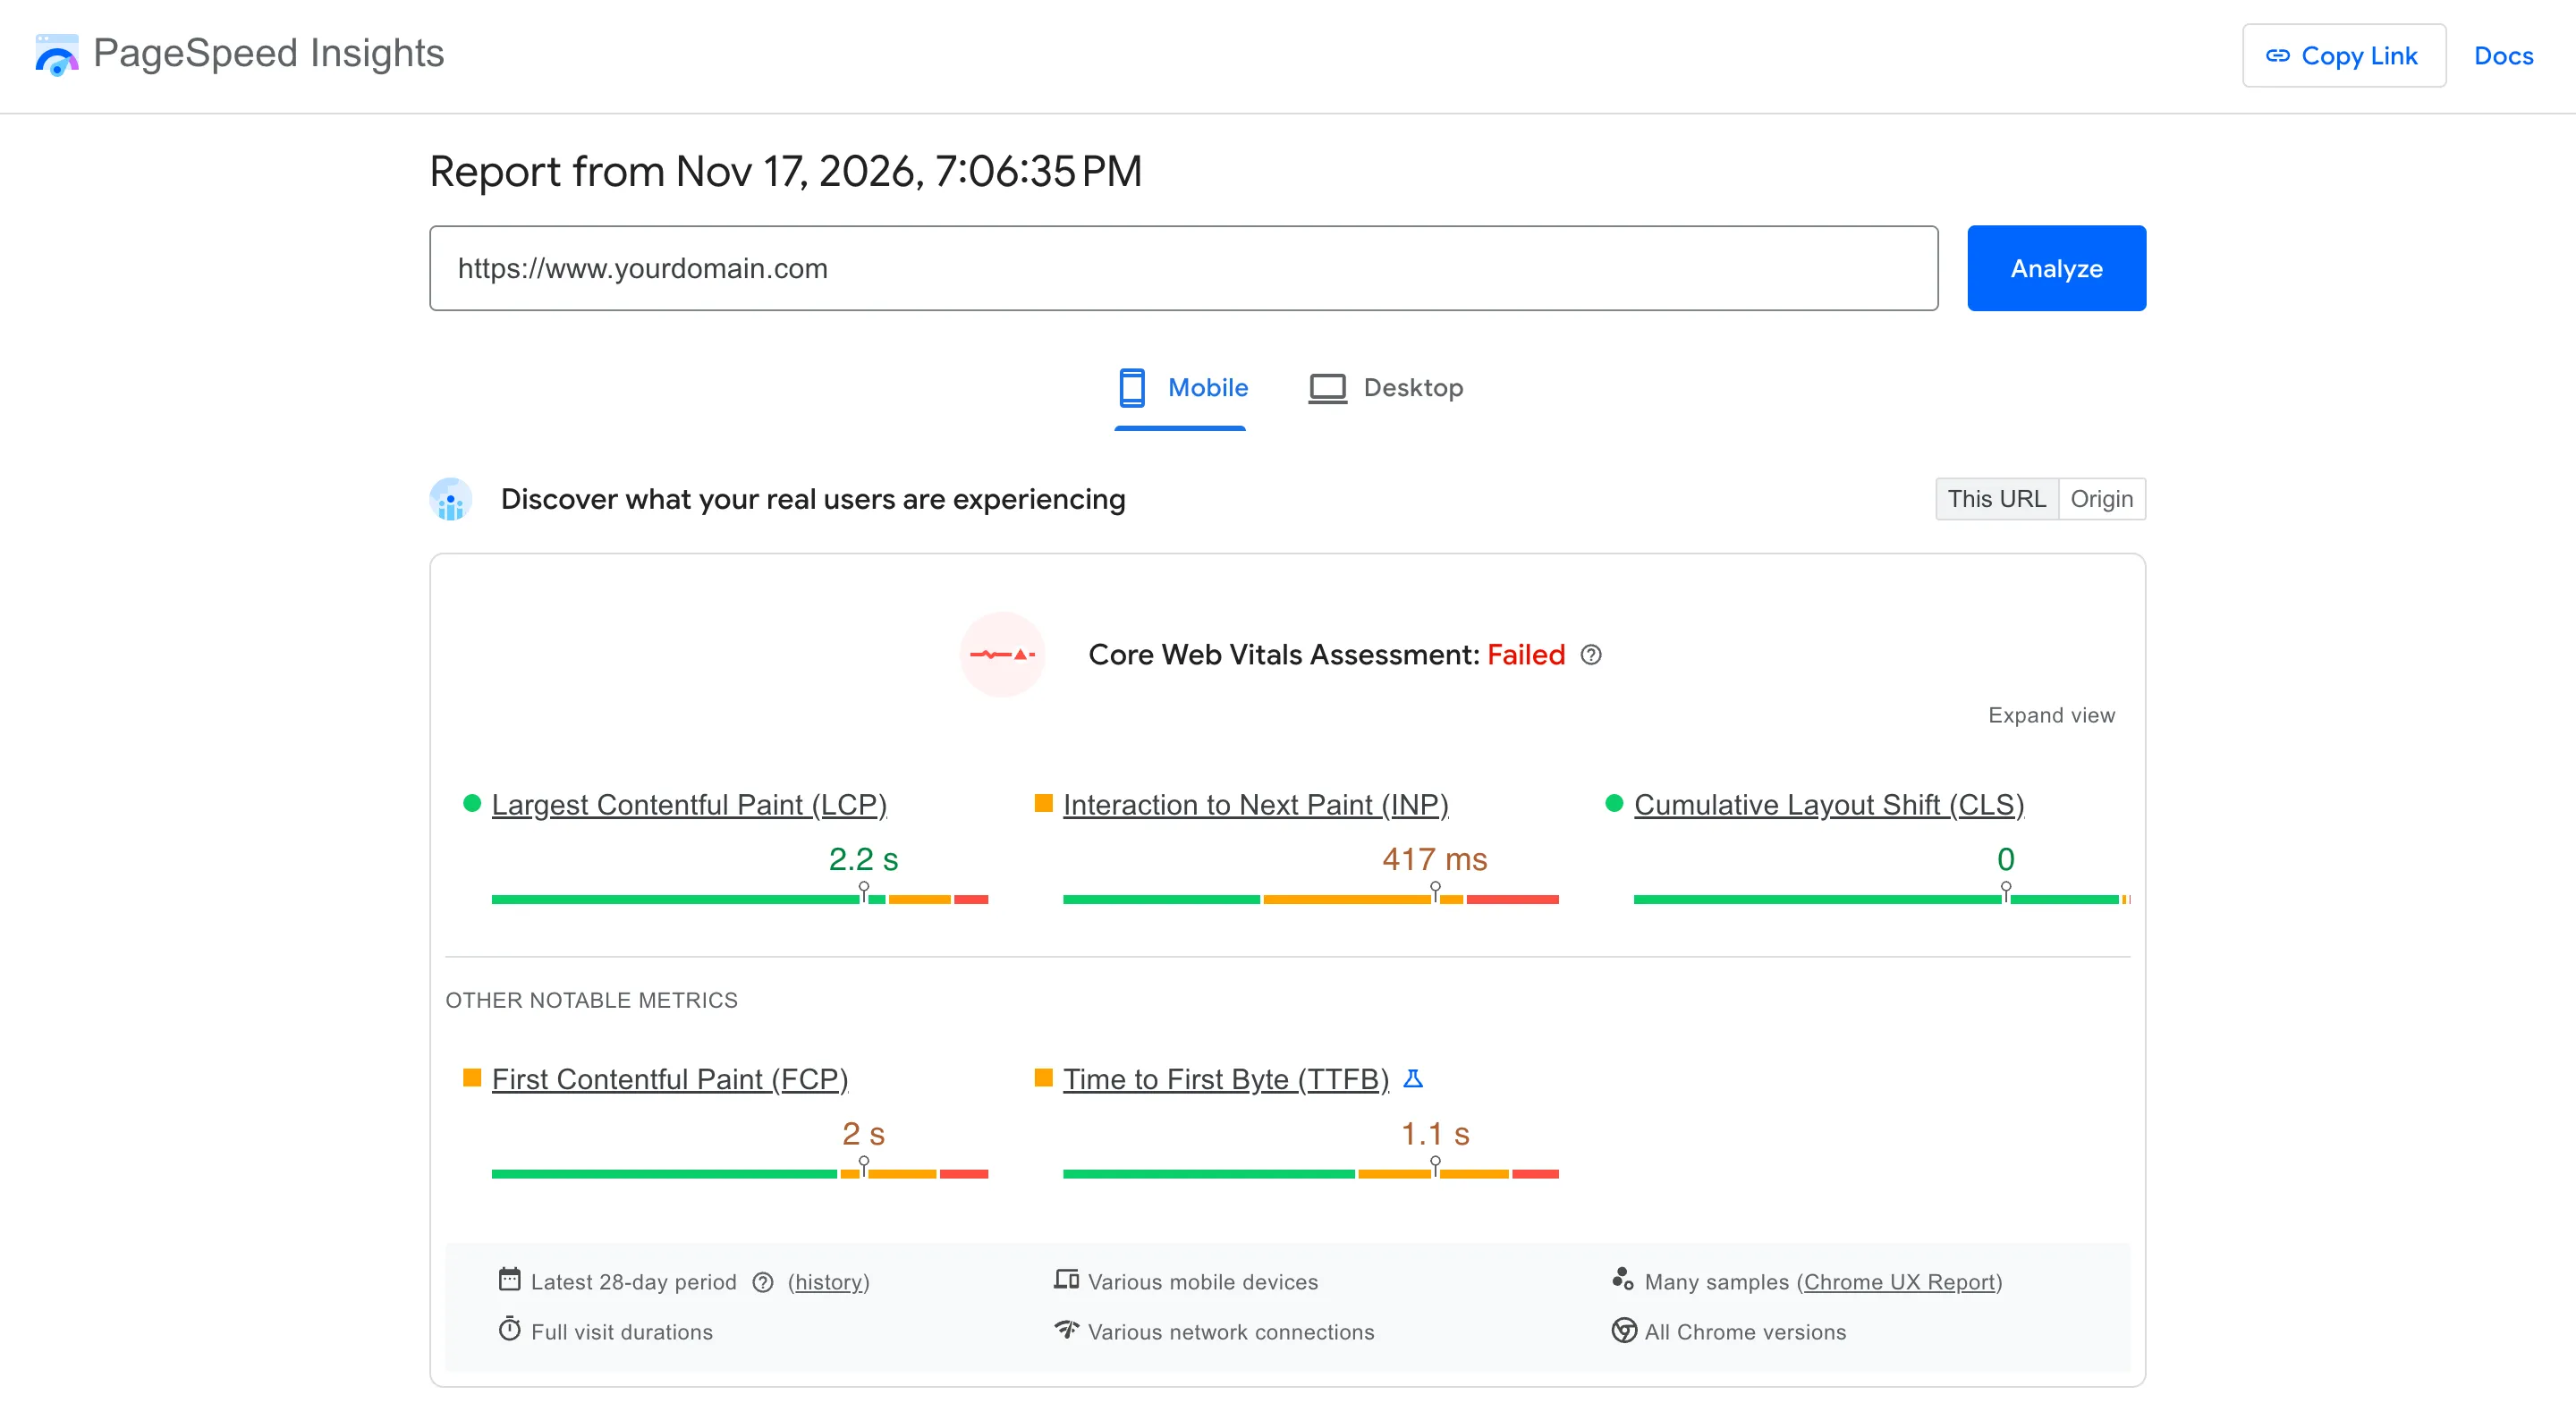
Weigh each script's real business value against the lag it introduces, and drop or delay extras that add weight without helping visitors convert (see how to test mobile website performance when third-party tags pile up). Watching third-party scripts INP, auditing tracking scripts, and checking chat widget performance helps you improve INP without losing sight of conversions.
9. Make Forms, Search, Menus, and Filters Feel More Responsive
Modern styling cannot rescue a form that locks up on submit, a search box that stutters mid-word, or a menu or filter that takes too long to update.
Clear validation, visible pending states, guardrails against double submits, lighter menu logic, and focused result updates keep key tasks moving smoothly (and connect naturally with a solid internal linking strategy for small business so visitors find the right pages fast). Prioritizing responsive forms, fast website menus, search interaction performance, and responsive filters supports real customer actions.
| What the Investigation Reveals | Likely Cause | What to Investigate |
|---|---|---|
| Input delay is high | Browser main thread is busy | Long tasks, animations, initialization scripts |
| Processing time is high | Event callbacks take too long | Expensive handlers, calculations, DOM updates |
| Presentation delay is high | Browser takes too long to display the result | Rendering work, layout, style recalculation, painting |
| Search interaction feels sluggish | Too many requests or expensive filtering | Debouncing, efficient filtering, result rendering |
| Menu opens late | Heavy event handlers or unnecessary component rendering | Simplify menu logic and render only necessary content |
| Form click appears ignored | No immediate visual acknowledgement | Show a pending state and prevent duplicate submissions |
| Mobile interactions are worse | Limited processing capacity | Reduce main-thread work and test on realistic devices |
10. Improve INP on Mobile Devices and Slower Browsers
A desktop machine can mask script overhead that immediately bogs down a phone with a slower CPU, tighter memory, and touch gestures.
Test on real phones with realistic throttling and interaction traces rather than trusting a fast laptop alone (and pair this with our guide to improve Largest Contentful Paint so loading and interaction both feel quick). Strong mobile INP work improves mobile interaction responsiveness and sharpens mobile JavaScript performance where visitors actually browse.
11. Test INP Improvements and See Whether Real Visitors Notice the Difference
One quick lab run only tests one moment and one set of actions—it does not guarantee every button feels fast across real sessions.
Compare before-and-after traces using Google Lighthouse and Chrome DevTools, then watch real-user field trends in Google PageSpeed Insights and Search Console over the 75th-percentile window. Checking INP field data lets you test INP score, measure INP, and monitor Core Web Vitals with real evidence (and keep media lean with our guide to optimize website images for SEO).
12. Build a Faster Interaction Experience into Every Website Page
Treat interaction speed as a habit before publishing, not a rescue job after complaints start rolling in.
Check key buttons, menus, forms, and mobile traces before shipping new updates. When you build with BoltWeb, everything is set up to scale as your business grows, and you still want to test real interactions on your live pages so new features do not add lag. Steady website interaction optimization and sound INP best practices on the BoltWeb website builder help you improve INP page after page.
Test Every Tap Before Your Next Buyer Walks Away
Picture a visitor tapping a filter, opening a menu, and sending a form on a busy phone—seeing an immediate response instead of wondering if your site froze.
Open your next page in BoltWeb, try every key button and form yourself across devices, and create a business website where every click moves people forward smoothly.
Get Started On Your Journey →FAQs: Improve Interaction to Next Paint (INP)
I click something on my site, and nothing happens immediately—is my page broken, or is it just struggling to keep up?
Nothing feels more frustrating than tapping a button or opening a menu and wondering whether your click even registered. When a control hangs or a form gives no sign of life, visitors lose patience fast—and plenty of buyers back out before a request ever goes through.
Learning how to improve Interaction to Next Paint (INP) helps you catch sluggish website responsiveness and fix a slow button response before it costs you leads. As a general benchmark, interactions at 200 ms or less feel prompt, 200 to 500 ms can start feeling delayed, and anything above 500 ms tends to feel sluggish. If you want a clean starting structure without building every layout block from scratch, BoltWeb and AI Foundry inside BoltWeb help you set up pages fast while still letting you test real interactions on your live site.
Does INP measure how quickly my entire website loads or how fast individual actions respond?
Initial page load speed tells you how fast the screen first paints, not how snappy that page feels once someone actually starts using it.
The Interaction to Next Paint metric watches clicks, taps, and keyboard input across a visit, measuring from user action until the browser renders the next visual update—not just initial loading or the first click alone. Clear INP measurement makes the INP meaning much easier to apply when you tune real controls.
How do I know which button, menu, or filter is frustrating visitors the most?
A broad score can hide the exact control holding people back—whether that is a navigation drawer, live search input, product filter, dropdown, submit button, modal, or checkout step.
Different visitors can also run into different delays based on their device, browser state, and what they tap. Pairing Google PageSpeed Insights, Chrome DevTools, and the Chrome UX Report supports focused INP debugging so you can identify slow interactions, spot slow website buttons, and track down specific INP issues.
My button eventually works, but where is all that time going?
A single slow tap usually splits into three separate phases, and each one points toward a different fix:
- Input delay: Time spent waiting before event handling begins because earlier browser work is still running.
- Processing time: Time spent executing event callbacks triggered by the interaction.
- Presentation delay: Time until the browser finishes layout, paint, and compositing to display the next frame.
Separating input delay, processing time, and presentation delay turns a murky INP breakdown into a clear diagnostic check alongside our guide to fix Core Web Vitals.
Could a script running in the background be stopping my buttons from responding?
Much of a browser's UI and script work runs on a single main thread. When heavy loops, large calculations, big DOM changes, synchronous work, or startup code tie up that thread, a visitor's tap has to wait in line.
Recording a performance trace helps you uncover long JavaScript tasks driving main thread blocking and JavaScript INP lag. Stronger browser responsiveness starts by finding which code keeps the queue backed up.
My search button, menu, or filter only responds after a noticeable pause—how do I make it react right away?
Event handlers stay snappier when they avoid extra work inside the click callback, use clean event delegation where suitable, and show immediate visual feedback so the visitor knows their action was received right away.
Keeping event handlers INP lean helps improve button response, trims click delay, and makes JavaScript event optimization practical on everyday controls.
I need all these website features, but I don't want them making the site feel sluggish—what can I do?
You do not have to gut helpful features just to make a page feel quicker. Yielding back to the browser between chunks, code splitting, delaying non-essential setup until needed, or moving heavy math to a worker can keep features intact while easing the load.
Thoughtful JavaScript performance optimization helps you reduce JavaScript execution, break up long tasks, and use web workers where they fit without sacrificing what makes your page useful.
I added chat, analytics, and marketing tools—are they making my website less responsive?
Analytics tags, ad scripts, chat widgets, tracking pixels, heatmaps, social embeds, and external libraries all compete for main-thread time—especially right when someone clicks or types.
Compare each tool's real business value against the lag it adds, and delay or drop scripts that cost speed without pulling their weight (see how to test mobile website performance when third-party tags pile up). Reviewing third-party scripts INP, auditing tracking scripts, and checking chat widget performance helps you improve INP without losing sight of conversions.
Why does every action feel delayed even though the website looks modern?
Polished visual styling cannot save a form that locks up on submit, a search bar that stutters mid-word, or a menu or filter that takes too long to update.
Immediate validation, visible pending states, protection against double submits, lighter menu logic, and focused updates keep key actions moving smoothly (and connect naturally with a clear internal linking strategy for small business so visitors reach the right pages easily). Prioritizing responsive forms, fast website menus, search interaction performance, and responsive filters supports real customer actions.
My website feels fine on my computer, but visitors on phones complain that it freezes—why?
A desktop computer can easily breeze past script overhead that bogs down a phone with a slower CPU, tighter memory limits, shifting signals, and touch interactions.
Testing on real phones with realistic throttling and interaction traces shows what mobile visitors actually hit (and pairs naturally with our guide to improve Largest Contentful Paint so loading and interaction both feel responsive). Focused mobile INP work lifts mobile interaction responsiveness and sharpens mobile JavaScript performance on real handsets.
I changed the JavaScript, but how can I tell whether the experience actually improved for visitors?
A single passing lab run only captures one snapshot and one set of clicks—it does not prove every interaction is fast across real sessions.
Compare before-and-after traces using Google Lighthouse and Chrome DevTools, then track real-world field trends in Google PageSpeed Insights and Search Console over the 75th-percentile window. Checking INP field data lets you test INP score, measure INP, and monitor Core Web Vitals with real evidence (while keeping visuals lean via optimize website images for SEO).
How do I stop adding new features that make the website feel slower over time?
Make interaction speed a routine check before publishing every update, rather than treating lag as an emergency cleanup months later.
Reviewing key buttons, menus, forms, and mobile traces before shipping new changes keeps new features from weighing down the experience—and when you build with BoltWeb, you get a foundation built to scale while still testing real interactions on your live pages. Steady website interaction optimization and sound INP best practices on the BoltWeb website builder help you improve INP as your site grows.
Picture a visitor tapping a product filter, opening a navigation menu, and submitting an inquiry on their phone—seeing an immediate visual response instead of wondering whether your page froze mid-click.