

You review your Search Console performance reports on a quiet Tuesday evening, filter by your highest-converting service landing page, and stare at a frustrating technical warning:
Here is the plain truth:
Speed is only half the battle. A webpage can load its initial text in under two seconds, yet still freeze up entirely when a prospective buyer tries to click a menu, or jump around erratically just as they go to tap a checkout button.
Core Web Vitals measure the actual tactile experience real humans encounter on your website. Mastering how to fix Core Web Vitals turns a sluggish, frustrating interface into a lightning-fast, stable storefront that keeps visitors engaged and satisfies search engine performance standards.
Historically, diagnosing complex performance bottlenecks required hours of wrestling with developer consoles, parsing waterfall charts, and rewriting raw server scripts. Modern platform architecture removes that technical friction completely.
When you build your business on BoltWeb, you can Fix Canonical URL Errors and optimize performance quickly without needing complicated developer tools or rigid third-party software that makes technical maintenance harder. Inside your BoltWeb dashboard, high-speed asset delivery, clean DOM structures, and automatic performance optimization are handled right out of the box—giving you the exact solution you need right away so you can focus on growing your business.
Here is your master operational blueprint to master LCP, INP, and CLS, eliminate performance drag, and scale your website speed.

1. What Are Core Web Vitals, and Why Should You Fix Them?
Let's clear up a major misconception right from the start:
Core Web Vitals are not a mysterious ranking hack that guarantees instant page-one dominance. They are standardized user-experience metrics established by Google to quantify how a webpage actually feels to load, interact with, and read (see official documentation in Google Search Central: Understanding Core Web Vitals and Google Search).
Core Web Vitals Thresholds
| Metric | Good | Needs Improvement | Poor |
|---|---|---|---|
| LCP | ≤ 2.5 seconds | 2.5–4 seconds | More than 4 seconds |
| INP | ≤ 200 ms | 200–500 ms | More than 500 ms |
| CLS | ≤ 0.1 | 0.1–0.25 | More than 0.25 |
These thresholds are evaluated at the 75th percentile of real-user visits, separately for mobile and desktop.
Understanding how to fix Core Web Vitals, improve Core Web Vitals SEO signals, and elevate overall website performance prevents visitors from abandoning your site out of frustration (explore broader audits in our website SEO audit checklist for small business).
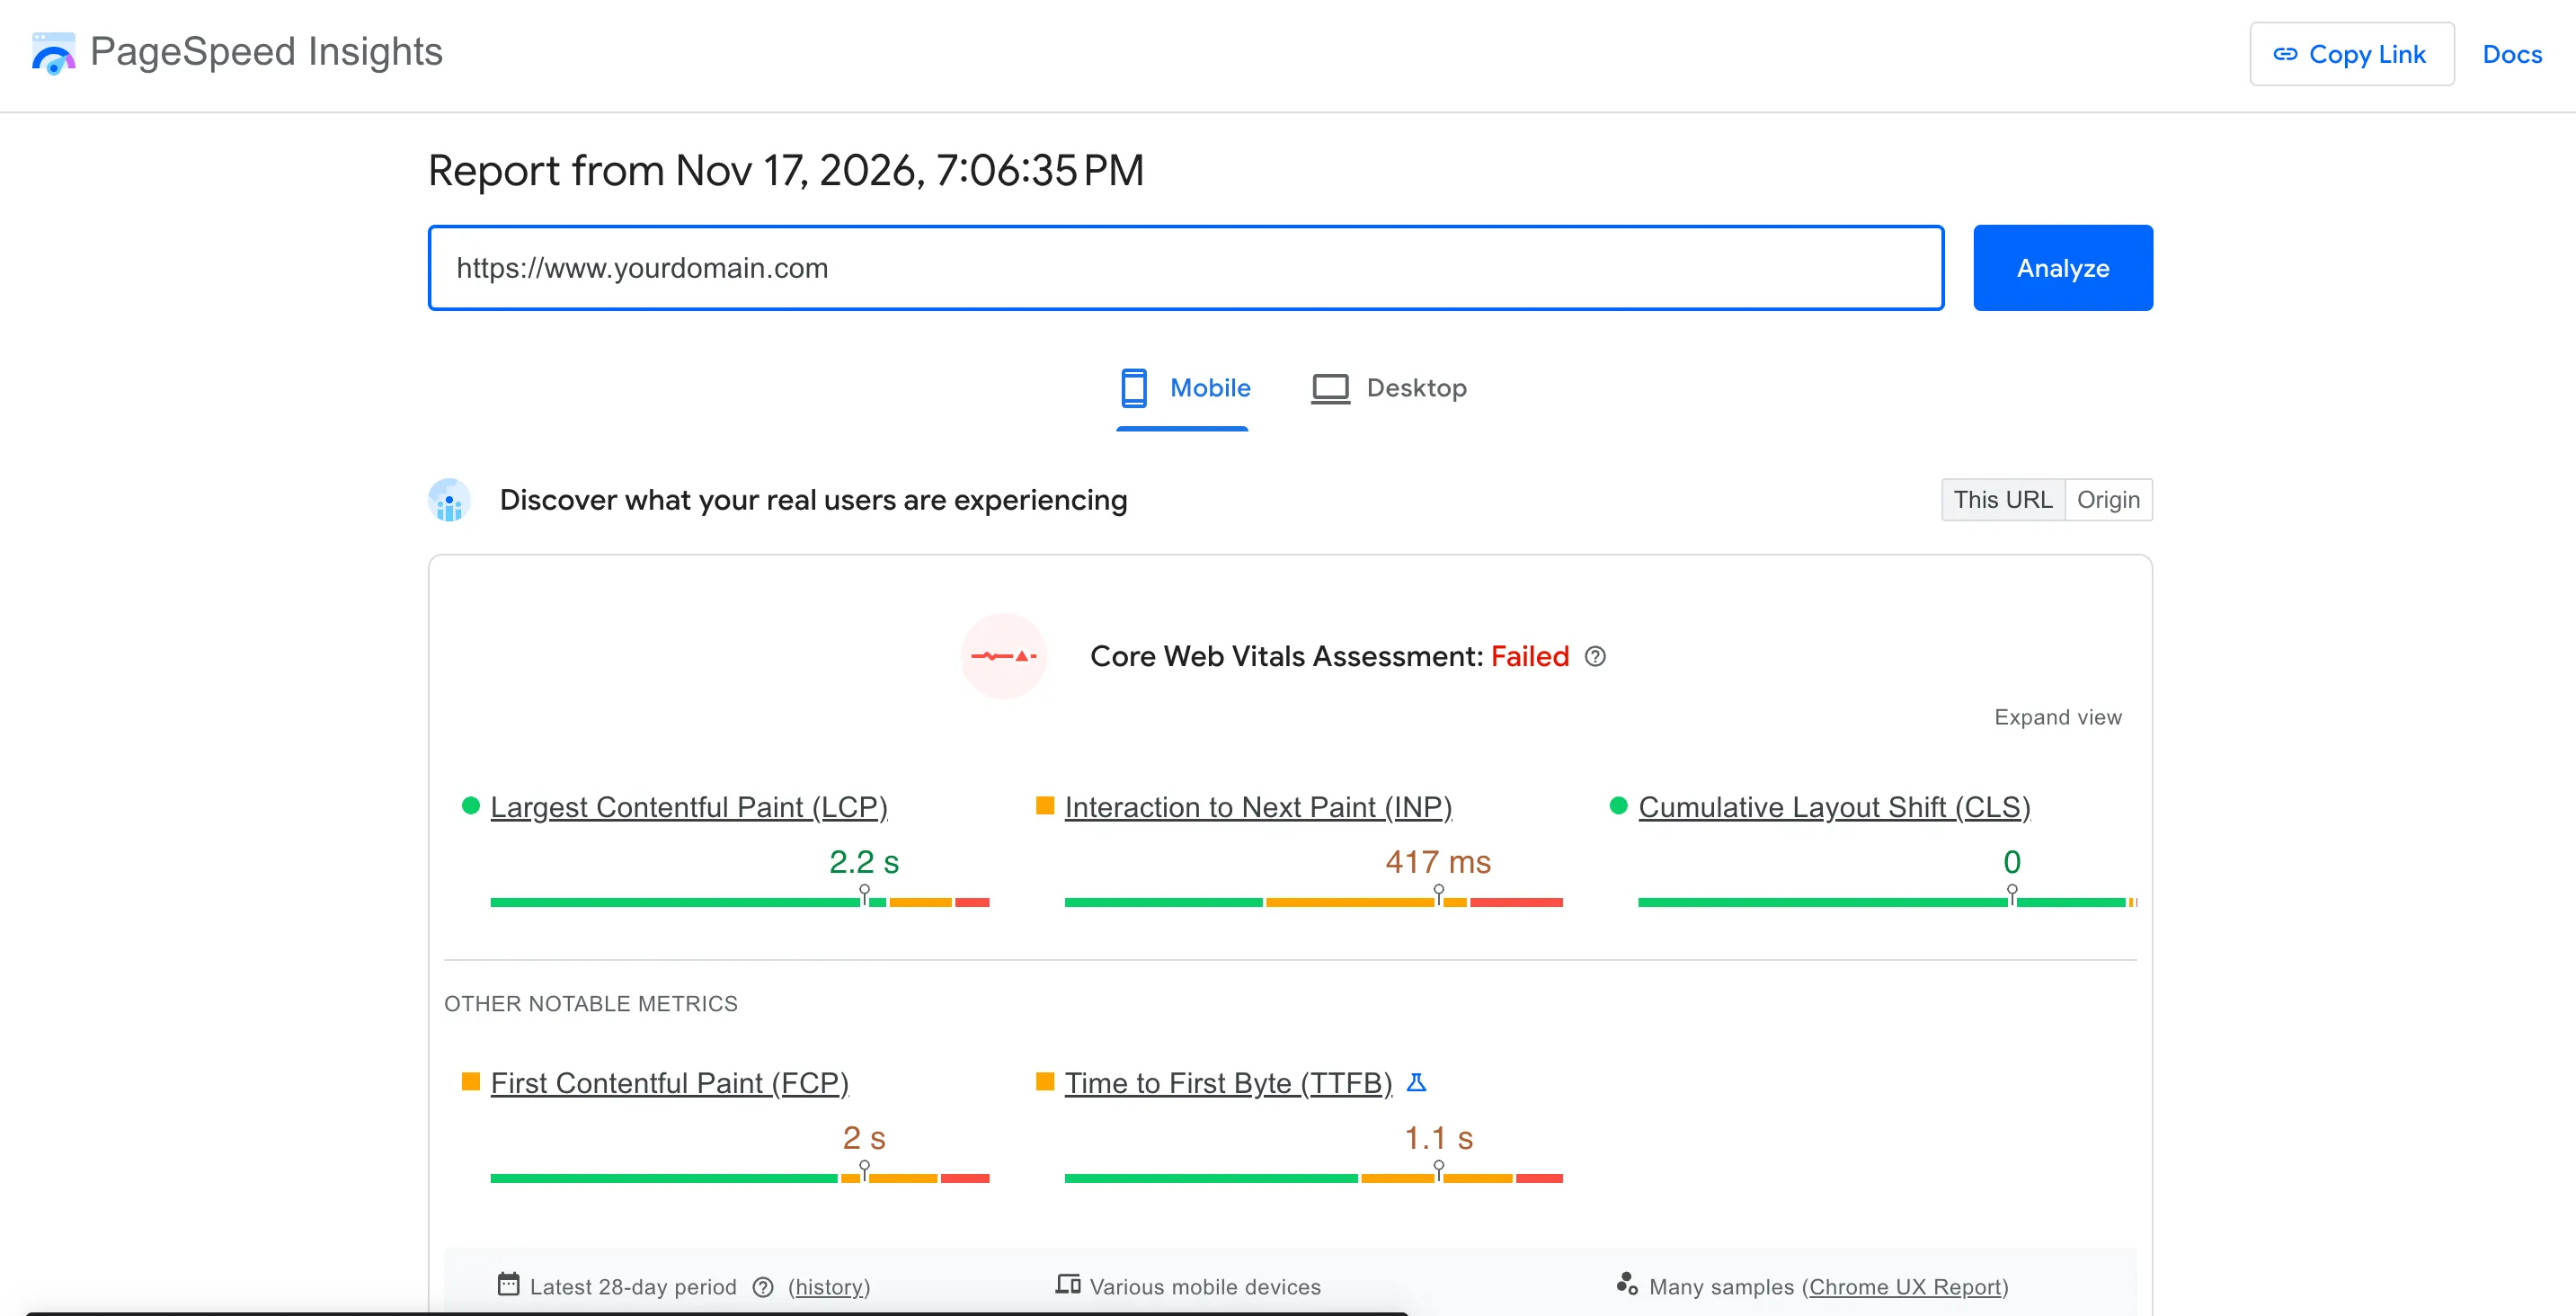
2. Check Core Web Vitals with PageSpeed Insights and Google Search Console
Trying to optimize website speed without checking your actual performance reports is like driving blindfolded at night.
Distinguish between your primary testing environments:
- Google PageSpeed Insights (Lab & Field): Evaluates individual URLs under controlled laboratory conditions using Google Lighthouse while pulling aggregate real-user experience data from the Chrome UX Report (CrUX).
- Google Search Console (Field Data): Groups your entire domain into performance cohorts based on how real humans experienced your pages over the past 28 days (review reporting guides in the Google Search Console: Core Web Vitals Report).
Learning how to check Core Web Vitals, interpret PageSpeed Insights data, and analyze the Search Console Core Web Vitals report establishes an accurate baseline before changing code (learn how to identify duplicate URLs across your website before running performance audits).
3. Fix Largest Contentful Paint (LCP) to Make Main Content Load Faster
Largest Contentful Paint (LCP) measures how long it takes for the primary visible element—usually a hero banner image, heading block, or featured product photo—to render completely within the viewport.
Practical Implementation: Prioritize the Main Image
If the largest visible element is a hero image, make it discoverable early and avoid lazy-loading it:
<img
  src="/images/hero.webp"
  width="1600"
  height="900"
  alt="Business website homepage"
  fetchpriority="high"
>
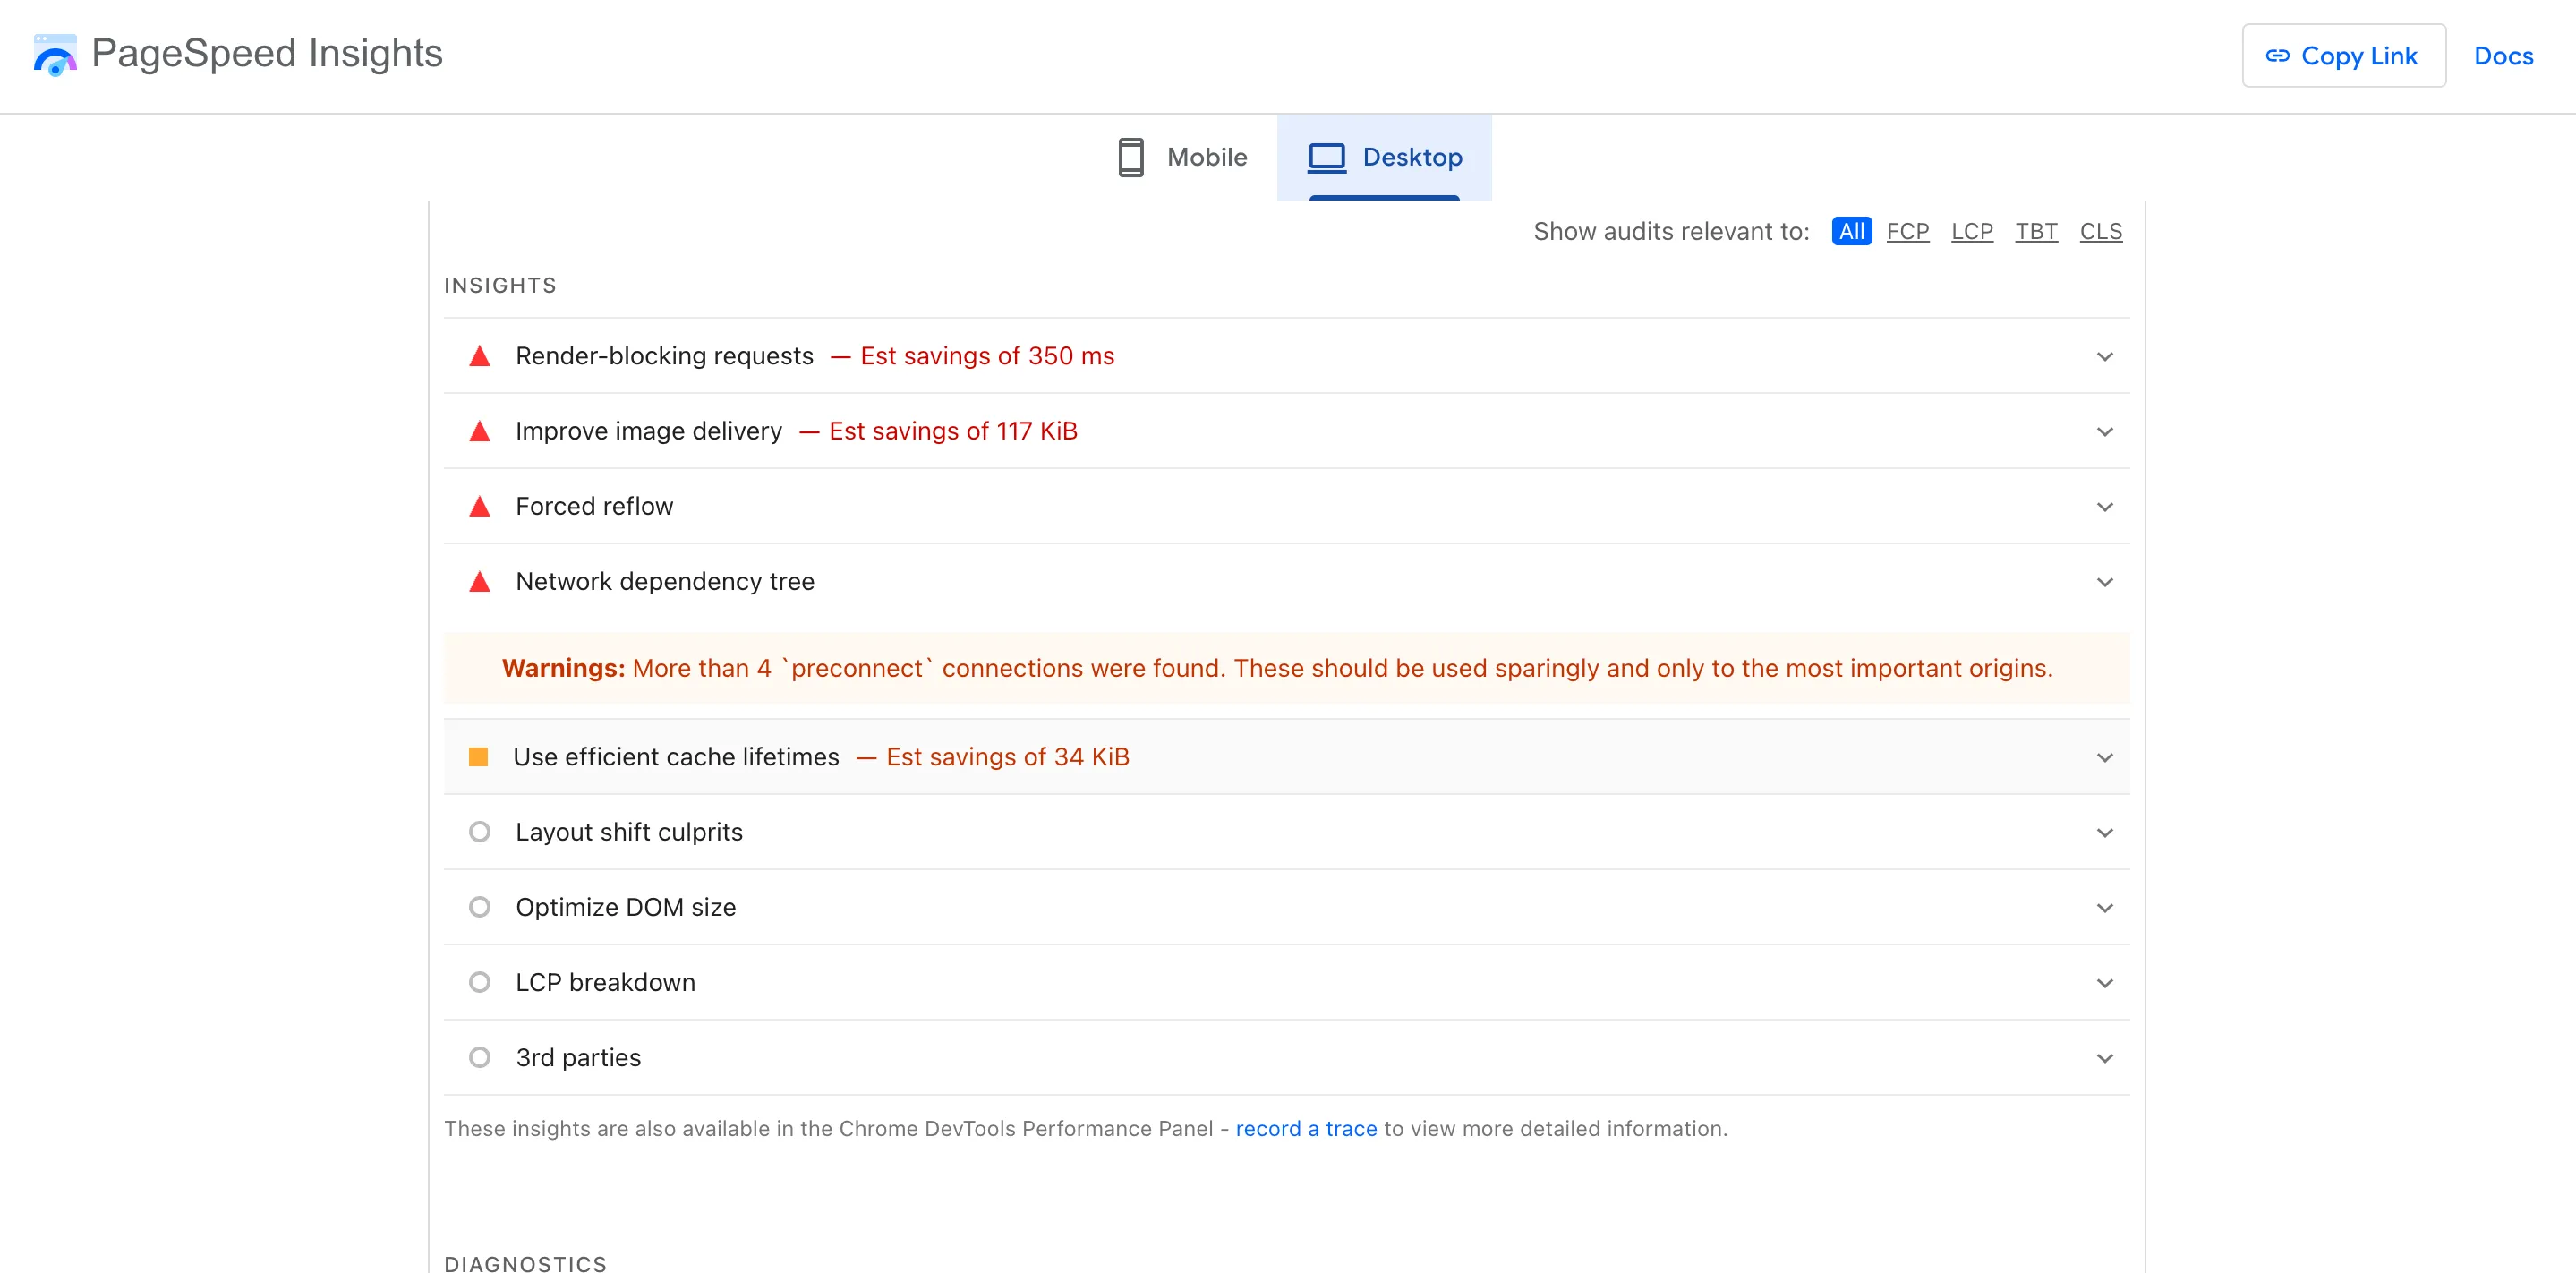
Readers should also check image dimensions, compression, server response times, and resource discovery. Preloading is useful only when the browser would otherwise discover the image late.
Core Web Vitals Troubleshooting Table: LCP
| Metric | Common Problem | First Fix to Investigate |
|---|---|---|
| LCP | Large hero image | Resize, compress, and prioritize the image |
| LCP | Slow server response | Review caching, hosting, backend processing, and CDN delivery |
| LCP | Late image discovery | Make the image discoverable in HTML and review preload requirements |
Mastering how to improve LCP, resolve poor LCP bottlenecks, execute advanced LCP optimization, and lower your overall LCP score ensures your main content renders instantly (learn the dedicated LCP field manual that walks through TTFB, image preloading, and render-blocking cleanup).
4. Improve Interaction to Next Paint (INP) and Make Pages Respond Faster
Interaction to Next Paint (INP) assesses your page's overall responsiveness by observing all click, tap, and keyboard interactions made throughout a visitor's session, measuring the time it takes for the browser to visually update the screen.
Practical Implementation: Break Up Long JavaScript Tasks
A large JavaScript task can prevent the browser from responding promptly to clicks and taps. Where appropriate, split non-urgent work into smaller tasks:
async function processItems(items) {
  for (let i = 0; i < items.length; i++) {
    processItem(items[i]);

    // Give the browser an opportunity
    // to handle other work.
    if (i % 50 === 0) {
      await new Promise(resolve =>
        setTimeout(resolve, 0)
      );
    }
  }
}
This is a simplified illustration, not a universal optimization to add to every loop. The actual solution may involve reducing JavaScript, improving event handlers, limiting DOM updates, or breaking up long tasks.
Core Web Vitals Troubleshooting Table: INP
| Metric | Common Problem | First Fix to Investigate |
|---|---|---|
| INP | Long JavaScript tasks | Break up tasks and reduce unnecessary JavaScript |
| INP | Heavy click handlers | Simplify event processing and defer non-essential work |
| INP | Excessive DOM updates | Reduce expensive rendering and layout calculations |
Taking steps to improve INP, execute targeted INP optimization, fix poor INP bottlenecks, and boost overall website responsiveness keeps menus and buttons snapping instantly to user input.
Build High-Converting Storefronts with BoltWeb
Automate Speed Optimization and Deliver Lightning-Fast Digital Experiences
Stop losing prospective buyers, lower conversion rates, and poor search rankings to sluggish server responses, heavy JavaScript files, and unstable page layouts. Build your digital storefront on BoltWeb, attach your custom domain, and let AI Foundry automatically optimize your asset delivery, streamline DOM structures, and maintain flawless Core Web Vitals so your business stays fully optimized for maximum search visibility without manual coding.
Get Started On Your Journey →5. Reduce Cumulative Layout Shift (CLS) and Stop Unexpected Page Movement
Cumulative Layout Shift (CLS) measures visual stability by tracking unexpected element movements during the rendering process—such as a late-loading banner ad pushing your navigation menu down right as you click a link.
Practical Implementation: Reserve Space for Images
Images without reserved dimensions can push surrounding content down when they appear:
<img
  src="/images/product.webp"
  width="800"
  height="600"
  alt="Product displayed on a white background"
>
Or use CSS when dimensions are controlled through the layout:
.product-image {
  width: 100%;
  aspect-ratio: 4 / 3;
  object-fit: cover;
}
Reserved space helps prevent unexpected movement when an image loads.
Reserve Space for Dynamically Loaded Content
.ad-container {
  min-height: 280px;
  width: 100%;
}
Reserving a suitable area for advertisements, embeds, and other dynamic content can reduce layout movement. The reserved space should match the expected content size rather than being an arbitrary large blank area.
Core Web Vitals Troubleshooting Table: CLS
| Metric | Common Problem | First Fix to Investigate |
|---|---|---|
| CLS | Images without dimensions | Add width and height or reserve aspect-ratio space |
| CLS | Late-loading advertisements | Reserve space for ad placements |
| CLS | Injected banners and popups | Avoid inserting content above existing content unexpectedly |
| CLS | Font swapping | Use appropriate font loading and metric-compatible fallback fonts |
Applying strategies to improve CLS, fix annoying layout shift bugs, complete proper CLS optimization, and control cumulative layout shift creates a calm, predictable reading environment (explore how to correct conflicting canonical signals that can also introduce unexpected page redirects).
6. Find the Exact Elements and Scripts Causing Core Web Vitals Problems
Guessing which plugin or stylesheet is dragging down your site performance is a waste of productive hours.
Leverage professional developer diagnostics to isolate exact bottlenecks:
- Chrome DevTools Performance Panel: Record live loading timelines to spot long main-thread tasks, layout thrashing, and slow script executions.
- Lighthouse Audits: Run local audits in incognito mode to inspect specific element timings and render-blocking requests.
- PageSpeed Insights Diagnostics: Review automated recommendations detailing exact file sizes, unused code percentages, and problematic DOM nodes.
Mastering how to diagnose Core Web Vitals, isolate recurring Core Web Vitals issues, and utilize Chrome DevTools performance profiling pinpoints exact problem areas across your templates.
7. Reduce JavaScript, CSS, and Third-Party Scripts That Slow Down Your Website
Every tracking pixel, chat widget, social media embed, and marketing script you install forces mobile browsers to download, parse, and execute extra code before your page becomes interactive.
Streamline your script architecture:
- Audit Third-Party Tags: Evaluate whether analytics tags, heatmaps, and chat widgets generate enough business value to justify their performance cost.
- Defer Non-Essential Code: Apply async or defer attributes to JavaScript files so they load asynchronously without blocking page rendering.
- Remove Unused Plugins: Clean up bloated CMS plugins that load site-wide styles and scripts on pages where they aren't even used.
Consciously working to reduce JavaScript, eliminate render-blocking CSS, manage third-party scripts, and execute comprehensive website speed optimization lightens browser workloads (also see why your website is slow when third-party scripts override your other speed optimizations).
8. Optimize Images, Fonts, and Dynamic Content for Better Core Web Vitals
While compressing hero images is essential, ignoring secondary page assets leaves major performance gaps unaddressed.
Refine your asset delivery pipelines:
- Adopt Modern Image Formats: Serve raster graphics in next-gen formats like WebP or AVIF to drastically reduce file weights without losing visual clarity.
- Control Web Font Loading: Use font-display: swap and metric-compatible fallback fonts to prevent invisible text flashing or sudden layout jumps during font rendering.
- Isolate Dynamic Embeds: Wrap video players, map widgets, and social embeds in fixed-dimension container divs to neutralize layout shifts.
Executing steps to optimize images for Core Web Vitals, complete professional font optimization, serve responsive images, and reduce CLS anomalies ensures all page assets load in harmony (also see how to optimize website images for SEO so your hero asset supports LCP and CLS simultaneously).
9. Prioritize Core Web Vitals Fixes Without Breaking Your Website
Staring at a long list of PageSpeed warnings can cause immediate analysis paralysis. You must prioritize fixes based on business impact and implementation safety:
Always test code adjustments in a secure staging environment before pushing updates to your live storefront, make one change at a time to isolate performance gains, and verify that critical interactive elements continue functioning smoothly. Executing disciplined Core Web Vitals optimization, managing fix Core Web Vitals issues workflows, and planning strategic website performance improvements keeps your updates safe and stable.
10. Measure Core Web Vitals Improvements with Field Data and Lab Tests
Improving lab scores in a testing tool feels satisfying, but real-world success is measured by how actual customers experience your website across diverse mobile devices and network speeds.
Validate your performance updates systematically:
- Compare Lab vs. Field Reports: Understand that laboratory tests verify code changes instantly, while field data aggregates user experiences over a rolling 28-day window.
- Monitor Search Console Trends: Watch for moving URL groups transitioning from "Poor" to "Needs Improvement" or "Good" inside your search management dashboard.
- Inspect Network Waterfalls: Use tools like WebPageTest to verify that asset load sequences run efficiently.
Consistently working to monitor Core Web Vitals, test website performance, and analyze Core Web Vitals field data provides undeniable proof of technical progress (also see how Search Console reports track real-user performance gains after your Core Web Vitals fixes ship).
11. Follow A Core Web Vitals Checklist to Keep Your Website Fast and Stable
Maintaining elite website speed over the long term requires embedding performance checks into your everyday publishing routine rather than treating site speed as a one-time project.
Core Web Vitals Audit Checklist
| Audit Area | Key Maintenance Action |
|---|---|
| LCP (Loading) | Compress hero images, set fetchpriority="high", and optimize server response times. |
| INP (Responsiveness) | Break up long JavaScript tasks and audit third-party widget overhead. |
| CLS (Stability) | Define explicit width and height attributes on all images and embeds. |
| Asset Delivery | Serve WebP/AVIF formats and utilize efficient caching policies. |
| Mobile Validation | Test layout stability and touch targets separately on mobile viewports. |
| Field Monitoring | Review Search Console and CrUX reports monthly for emerging regressions. |
Adopting a thorough Core Web Vitals checklist, enforcing strict Core Web Vitals best practices, and working to continuously improve website performance protects your digital storefront permanently.
Recommended Core Web Vitals Tools
| Tool | Best Use in the Article |
|---|---|
| Google PageSpeed Insights | Test individual URLs and review field data and Lighthouse diagnostics. |
| Google Search Console | Find URL groups with poor or improving field performance. |
| Chrome DevTools | Inspect slow interactions, layout shifts, and loading timelines. |
| Google Lighthouse | Run controlled lab audits and identify performance opportunities. |
| WebPageTest | Inspect network waterfalls and compare loading behavior. |
| Chrome UX Report | Examine aggregated real-user experience data. |
Scale Your Website Speed and Search Visibility Effortlessly with BoltWeb
Wrestling with server configuration files, optimizing heavy JavaScript bundles, and manually debugging layout shifts across hundreds of pages shouldn't steal hours away from running your company.
When you build your online storefront on BoltWeb, clean DOM structures, automated asset optimization, and streamlined routing come built-in from the very first page you publish—while AI Foundry keeps watch behind the scenes so you can Fix Canonical URL Errors easily, maintain elite Core Web Vitals, and protect your search visibility without manual technical maintenance.
Deploy your next high-converting page on BoltWeb, connect your custom domain, and create a business website engineered to turn blazing-fast loading speeds into lasting revenue today!
Get Started On Your Journey →Frequently Asked Questions: Fix Core Web Vitals
1. Google says my website has poor Core Web Vitals, but my pages load in a couple of seconds—what does that actually mean for my visitors and my search rankings?
Here is the plain truth:
Speed is only half the battle. A webpage can load its initial text in under two seconds, yet still freeze up entirely when a prospective buyer tries to click a menu, or jump around erratically just as they go to tap a checkout button. Core Web Vitals measure the actual tactile experience real humans encounter on your website. Mastering how to fix Core Web Vitals turns a sluggish, frustrating interface into a lightning-fast, stable storefront that keeps visitors engaged and satisfies search engine performance standards.
When you build your business on BoltWeb, you can Fix Canonical URL Errors quickly without needing complicated developer tools or rigid third-party software that makes technical maintenance harder. Inside your BoltWeb dashboard, high-speed asset delivery, clean DOM structures, and automatic performance optimization are handled right out of the box—giving you the exact solution you need right away so you can focus on growing your business.
2. Which testing tool should I trust, and why does Google PageSpeed Insights show different results from Search Console?
Trying to optimize website speed without checking your actual performance reports is like driving blindfolded at night.
While tools like PageSpeed Insights evaluate individual URLs under controlled laboratory conditions using Lighthouse, your Search Console field data aggregates how real humans actually experienced your pages over the past 28 days across diverse mobile devices and real-world network speeds (also see how Search Console reports help you reconcile lab vs. field Core Web Vitals data).
3. My homepage takes too long to show its main content—how do I identify and fix the bottleneck behind my slow LCP?
Largest Contentful Paint measures how long it takes for the primary visible element—such as a hero banner image or pricing headline—to render completely within the viewport.
Optimizing your server response times, making hero images discoverable in initial HTML, and applying fetchpriority hints ensures your main content renders instantly without making visitors wait (also see the dedicated LCP field manual that walks through TTFB, image preloading, and render-blocking cleanup).
4. My website loads, but why do buttons, menus, and forms feel sluggish when users try to tap them?
Interaction to Next Paint assesses your page's overall responsiveness by observing clicks, taps, and keyboard interactions made throughout a visitor's session, measuring the time it takes for the browser to update the screen.
Breaking up long-running JavaScript tasks into smaller execution slices and simplifying heavy event handlers keeps your menus and interactive buttons snapping instantly to user input.
5. Why does my webpage jump around erratically just as a visitor tries to click a link or button?
Cumulative Layout Shift measures visual stability by tracking unexpected element movements during the rendering process, such as a late-loading banner ad pushing your navigation menu downward unexpectedly.
Defining explicit width and height attributes on images, reserving exact CSS aspect ratios, and setting aside dedicated min-height blocks for dynamic embeds creates a calm, predictable reading environment (also see how to optimize website images for SEO so each asset reserves its layout box before loading).
6. I know my site performance score is poor, but how do I find the exact image, script, or component responsible?
Guessing which plugin or stylesheet is dragging down your site performance is a waste of productive hours.
Leveraging diagnostic tools like the Chrome DevTools Performance panel, local Lighthouse audits, and PageSpeed Insights diagnostics isolates exact DOM nodes, file sizes, and problematic scripts across your templates.
7. I've installed several plugins and marketing tools—could third-party tracking scripts be slowing down my website?
Every tracking pixel, chat widget, social media embed, and marketing script you install forces mobile browsers to download, parse, and execute extra code before your page becomes interactive.
Auditing third-party tool utility, deferring non-essential code asynchronously, and removing bloated CMS plugins lightens browser workloads and accelerates interactivity (also see why your website is slow when third-party scripts override your other speed optimizations).
8. I optimized my hero images, but why are my Core Web Vitals scores still failing to reach the good threshold?
While compressing hero images is essential, ignoring secondary page assets and poor font rendering leaves major performance gaps unaddressed.
Adopting modern raster formats like WebP or AVIF, controlling web font loading with font-display swap, and isolating dynamic embeds ensures all page assets load in complete harmony.
9. I don't know how to apply these technical speed fixes because my small business website runs on WordPress or Shopify.
Achieving elite performance scores does not require coding a custom web engine from scratch when modern content management platforms offer robust optimization pathways.
Configuring reputable caching plugins, optimizing database tables, selecting lightweight themes, and trimming bloated storefront apps allows you to elevate performance across managed environments without touching raw server code (also see how to improve your website SEO without coding by leaning on built-in platform optimizations).
10. There are dozens of PageSpeed recommendations—which performance fixes should I prioritize first for maximum impact?
Staring at a long list of optimization warnings can cause immediate analysis paralysis.
You must prioritize fixes based on user impact and implementation safety, testing code adjustments in a secure staging environment, making one change at a time, and verifying that critical interactive elements continue functioning smoothly.
11. I changed my site code, but how can I prove with absolute certainty that my performance fixes actually worked for real visitors?
Improving lab scores in a testing tool feels satisfying, but real-world success is measured by how actual customers experience your website across diverse mobile devices.
Comparing your updated Chrome DevTools loading waterfalls against rolling 28-day Search Console field data provides undeniable proof of technical progress and steady organic growth.
12. How do I stop performance problems from creeping back onto my website every time our team publishes fresh content?
Maintaining elite website speed over the long term requires embedding performance checks into your everyday publishing routine rather than treating site speed as a one-time project.
Following a repeatable step-by-step audit checklist—measuring baselines, auditing assets, testing mobile responsiveness, and monitoring field trends—protects your digital storefront permanently (also see the recurring SEO readiness checklist that keeps Core Web Vitals healthy after every publish).